Report Designer
On the design page of the report, click the settings button of "Report Designer" to enter the editor page of the designer.
Introduction to the Report Designer
The operation interface consists of the top menu bar, toolbar, toolbox on the left, design area in the middle , property setting panel and **data binding panel**on the right , as shown in the figure below.

| Serial number | Area name | Description |
|---|---|---|
| A | Menu Bar | Including menu buttons, undo, restore, save, save as, preview operation buttons and start, report, query panel function menus. |
| B | Tool bar | Commonly used shortcut operations. |
| C | Tool box | The toolbox contains report control elements that can be used in reports, such as tables, matrix tables, charts, etc. in: - Menu button  Equivalent to the expand/collapse switch of the tool box. When you expand the toolbox, you can see the name of each toolbox element; collapse toolbox to leave more space for the design area. - Element management 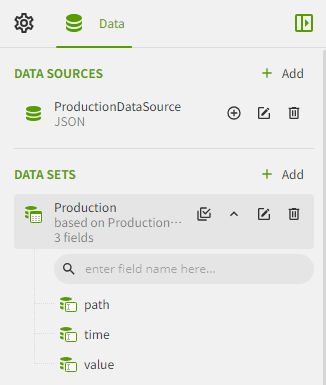 The constituent elements of the report are displayed in a tree directory. When an element node is selected, the settings panel on the right will switch to the property setting options for the corresponding element. - Group management 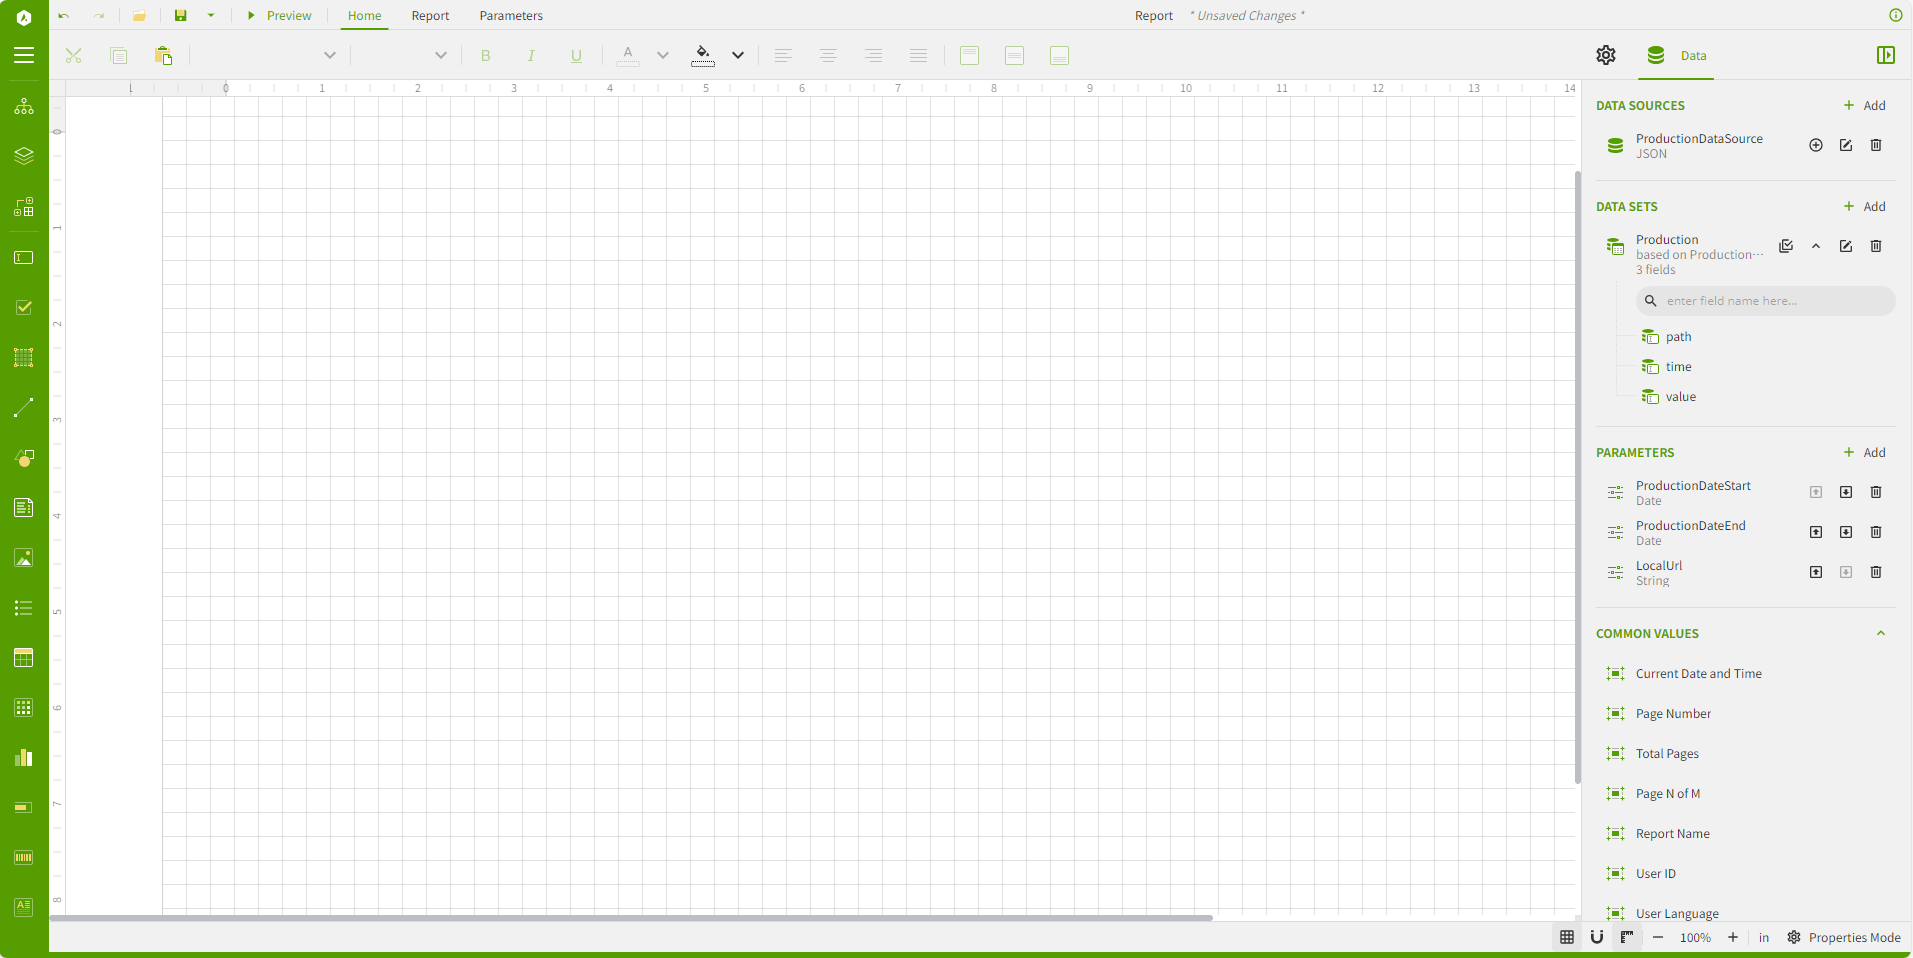 Display the data grouping information of the current moment table, and perform grouping management and operation. |
| D | Design Area | The middle part of the designer interface is the workspace for report design. You can drag and drop report elements from the toolbox to the design area and set their options. After turning on the ruler, you can adjust the size of the design area by dragging the edge of the ruler.  |
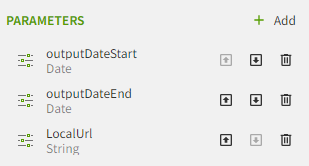
| E | Property settings and data binding panel | Property settings, data binding panel and report information settings, click to switch settings. - Property setting panel: Set various properties of the currently selected element in the report or design area. Depending on the type of the current element in the design area, the option settings will change. - Data binding panel: Set the data set and data set query parameters used by the report. - Report information setting panel: Set report information. Click on the  ,you can collapse/expand the side panel. This button not only exists in the designer, but also exists when previewing the report. Click to expand/collapse the side panel during preview. ,you can collapse/expand the side panel. This button not only exists in the designer, but also exists when previewing the report. Click to expand/collapse the side panel during preview. |
| F | Other settings | Other settings include grid switches, grid settings, scaling, size units, and property setting modes.  Grid switch, turned on by default, click to turn off grid mode. Grid switch, turned on by default, click to turn off grid mode.  Set grid size, alignment and auto-alignment. Set grid size, alignment and auto-alignment.  Turns the ruler on or off in the canvas. Turns the ruler on or off in the canvas.  Set the zoom of the design area. Set the zoom of the design area. 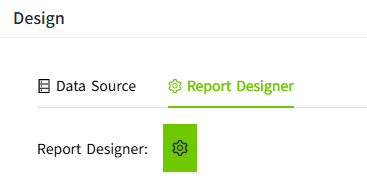 The unit of the design ruler. The unit of the design ruler.  You can choose basic attribute setting mode or advanced attribute setting mode. After selecting advanced attribute settings, the panel will display all options available for the current element; selecting basic attribute setting mode can hide less commonly used options. You can choose basic attribute setting mode or advanced attribute setting mode. After selecting advanced attribute settings, the panel will display all options available for the current element; selecting basic attribute setting mode can hide less commonly used options. |
Set report global properties
When you click the gray area in the design area so that no report elements are selected in the design area, the property setting panel on the right displays the global setting properties of the entire report.